Tainan Parking Space Prediction System

Introduction
This is our final project for the course “Manufacturing Data Science.”
For the original source code, please visit GitHub.
Collaborators
Hung-Kai Yang, Hao-En Sun, Yi-Lun Hung, Ching-Lin Chen, Fan-Jia (Hubert) Huang
1. Background and Motivation
1.1 Motivation
From past experience—especially in cities where public transportation is not widely adopted, such as Tainan people often rely on cars for weekend outings. However, when arriving at crowded areas or tourist spots, they frequently encounter difficulties finding available parking, leading to stress and uncertainty during trip planning. If people could know in advance whether parking is likely to be available in a specific area, it would help them make better transportation decisions (such as switching to a scooter or using public transit). Moreover, weather conditions significantly impact crowd levels and parking demand in tourist areas. Therefore, integrating weather forecasts with historical parking data for predictive purposes fulfills a clear social need and offers practical application value.
1.2 Background
As a major tourist destination, Tainan City experiences significant fluctuations in parking demand on holidays and under certain weather conditions. Developing a model that can predict parking availability—based on daily weather forecasts and historical parking usage—would provide valuable support for smart city initiatives and transportation information systems. In more advanced applications, the system could even recommend optimal parking spots based on price, location, and weather, thereby improving user convenience and reducing traffic congestion and illegal parking caused by people circling in search of spaces.
1.3 Problem Definition
This study aims to build a machine learning model using weather forecast data and historical parking usage records from Tainan City to predict whether parking spaces will be available in a specific area, along with the estimated number of available spots. Additionally, the research seeks to identify key influencing factors and evaluate the model’s prediction accuracy.
2. Methodology
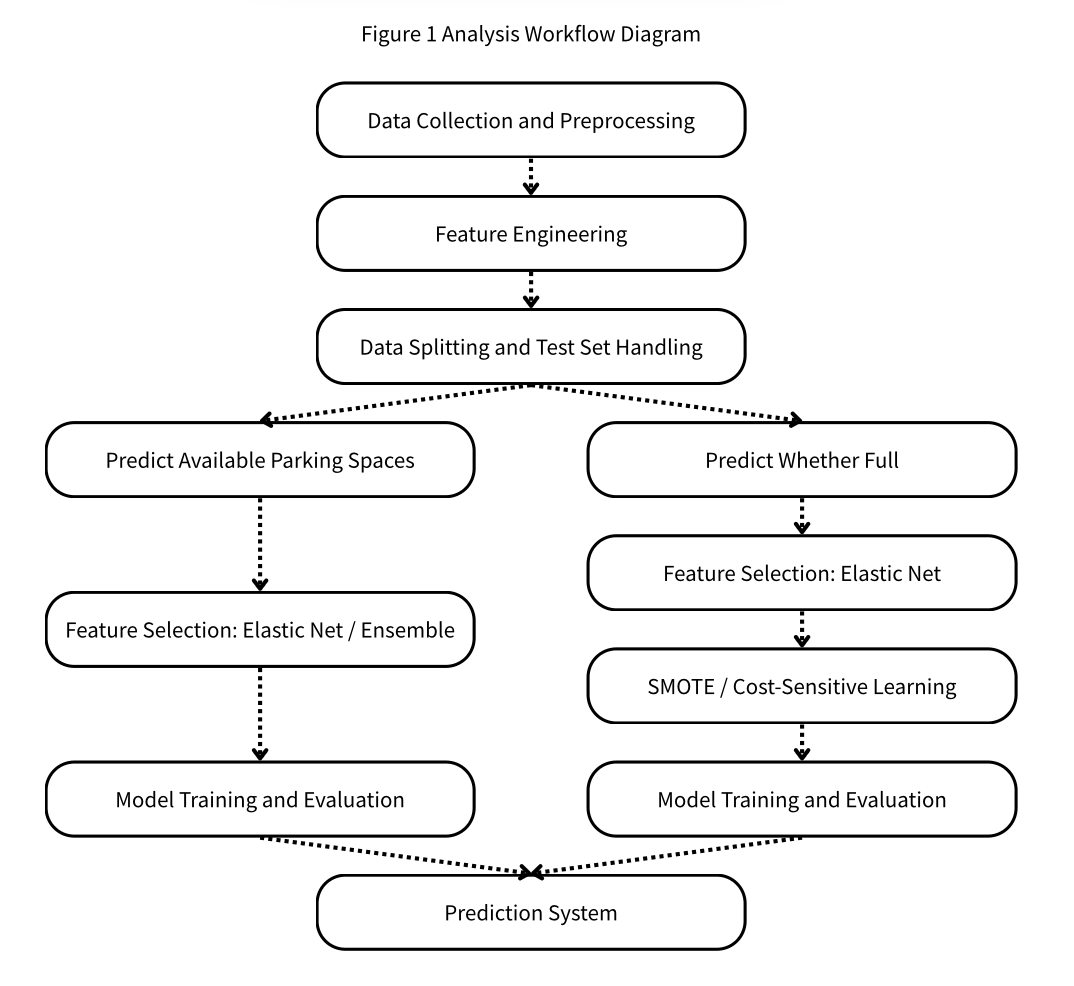
2.1 Research Process
2.1.1 Data Collection and Preprocessing
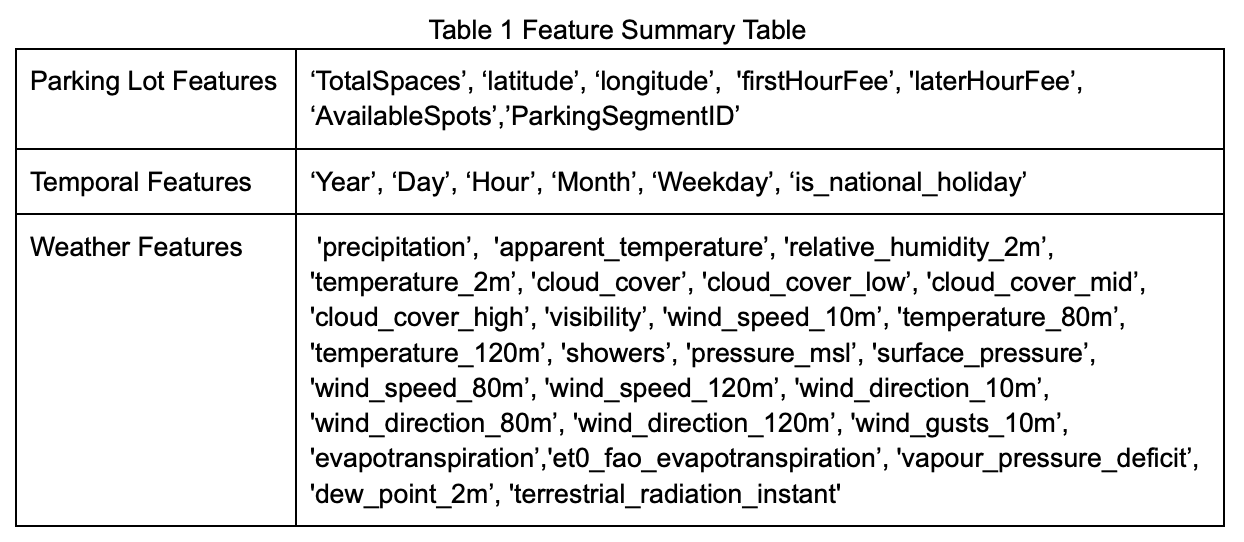
We collected historical data on weather forecasts, parking space availability, and national holidays. A summary of all data fields is shown in Table 1.
During the initial data cleaning phase, we discovered that in some cases, the number of available parking spots exceeded the total capacity of the parking lot. These values were corrected to match the maximum number of spaces available at each location.
To improve data interpretability and model training efficiency, we aggregated the original high-frequency timestamps into 30-minute intervals. For each interval, we calculated the average number of available parking spaces to serve as the representative value. The decision to use 30-minute intervals was based on the need to preserve meaningful trends in parking demand (e.g., peak vs. off-peak variations) while avoiding the noise and computational burden associated with overly fine-grained time resolution. This approach helps enhance model stability and predictive performance.
2.1.2 Feature Engineering and Selection
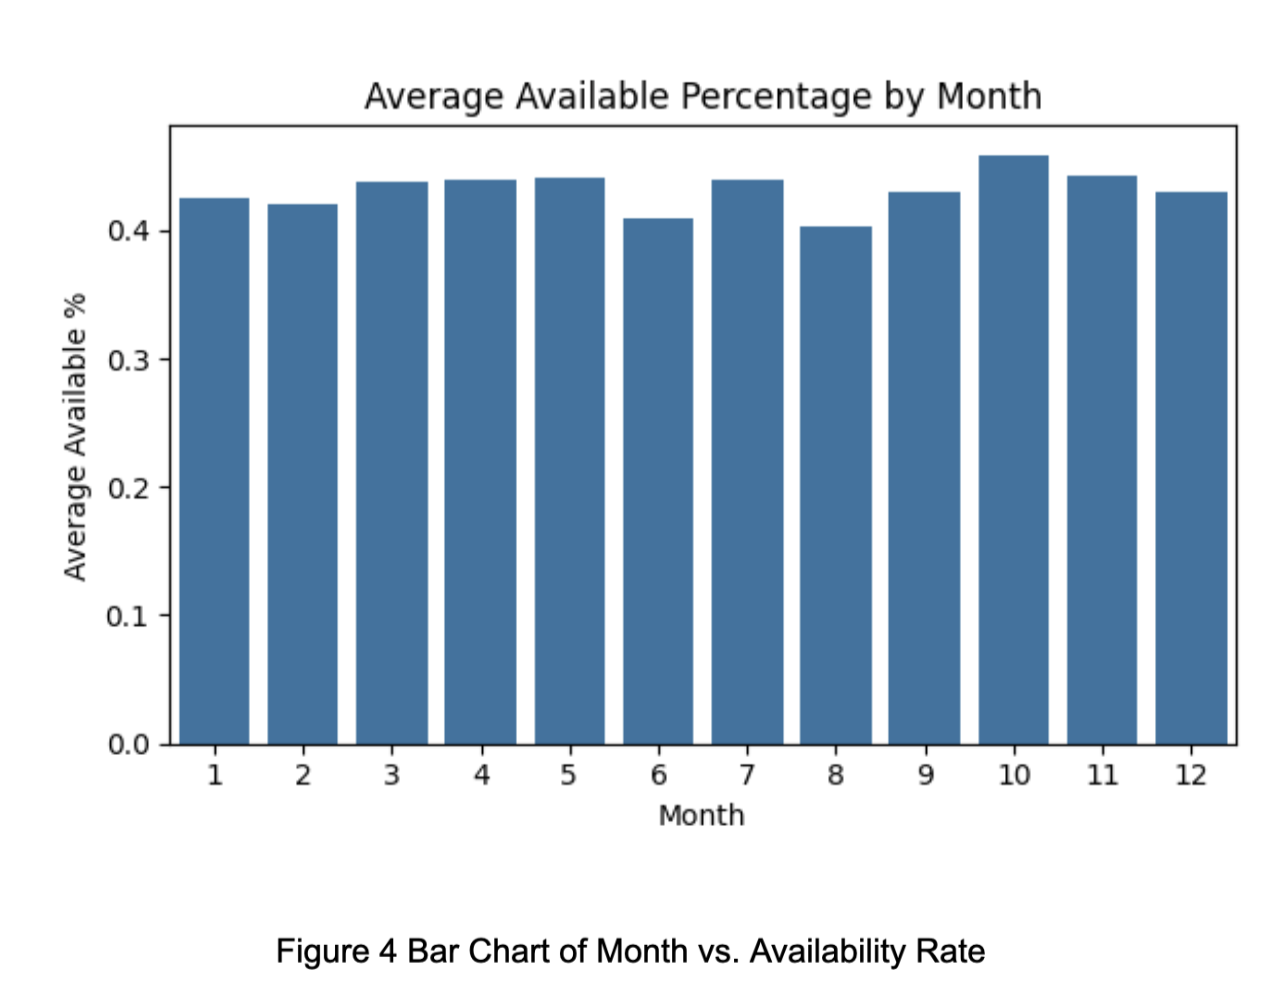
During the exploratory data analysis (EDA), we observed that the parking availability rate exhibits cyclical patterns across months, days of the week, and hours of the day.
As shown in Figure 2, the availability rate is significantly lower in June and August compared to other months.
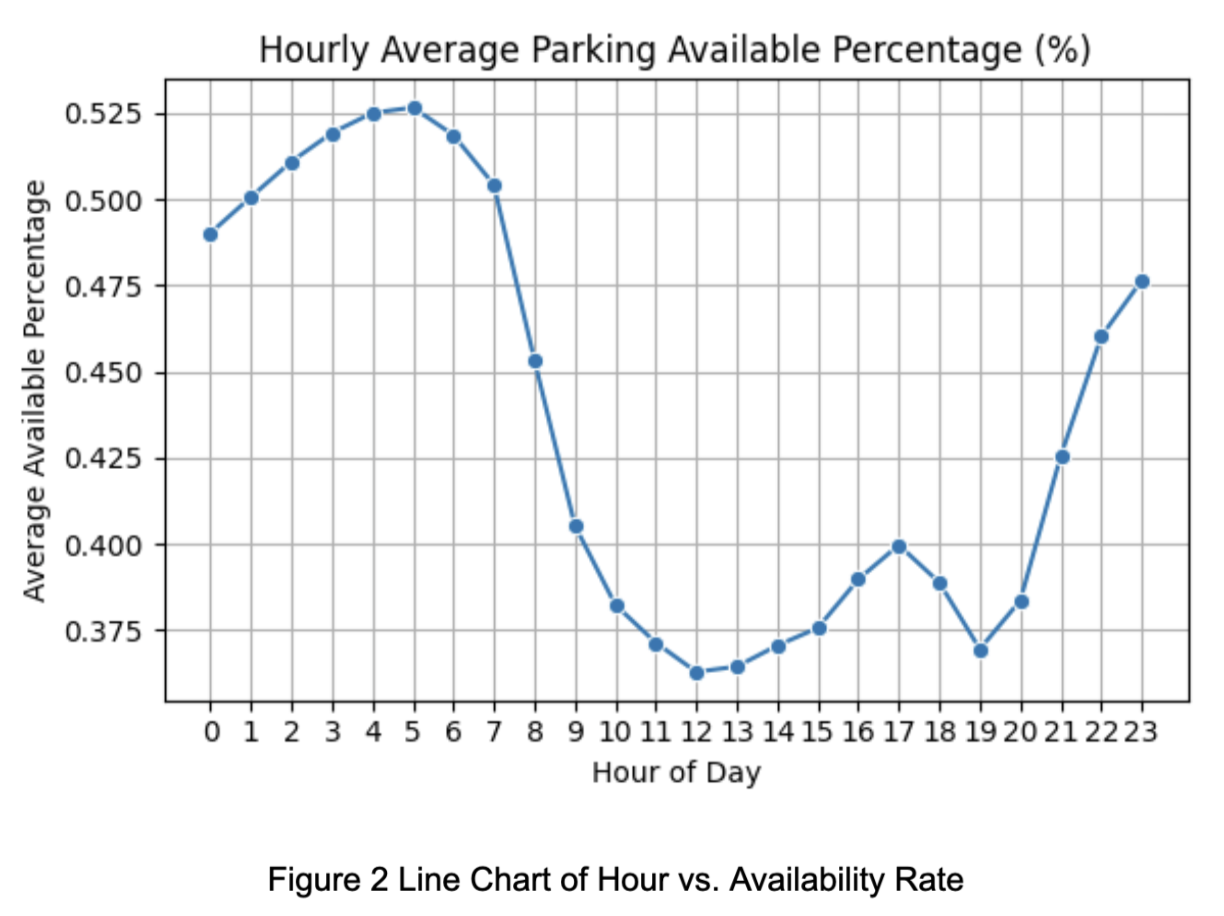
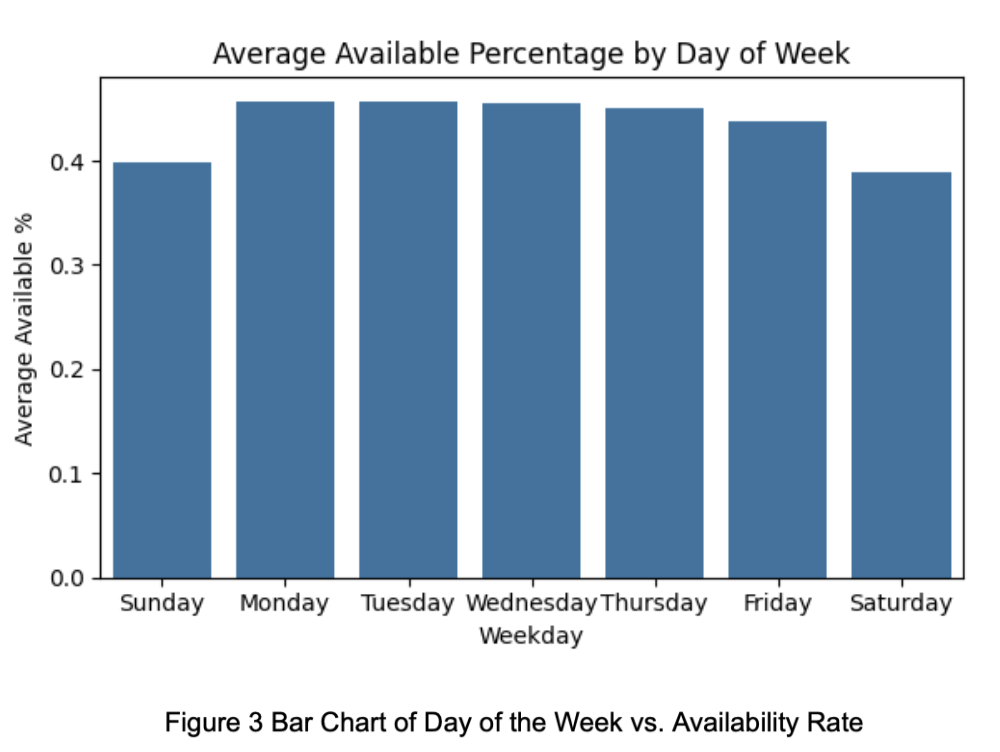
Figure 3 illustrates that availability is also relatively lower on weekends. Additionally, Figures 3 and 4 reveal that availability during the daytime—particularly peak hours—is notably lower than during other periods.
To preserve these periodic patterns, we applied one-hot encoding to the month and day of the week variables. However, since the number of unique values for the 30-minute time intervals and dates was too large, we applied sine-cosine encoding to both. Furthermore, since the 30-minute interval feature already contains information about the hour, we removed the original hour feature along with other redundant encoded fields.
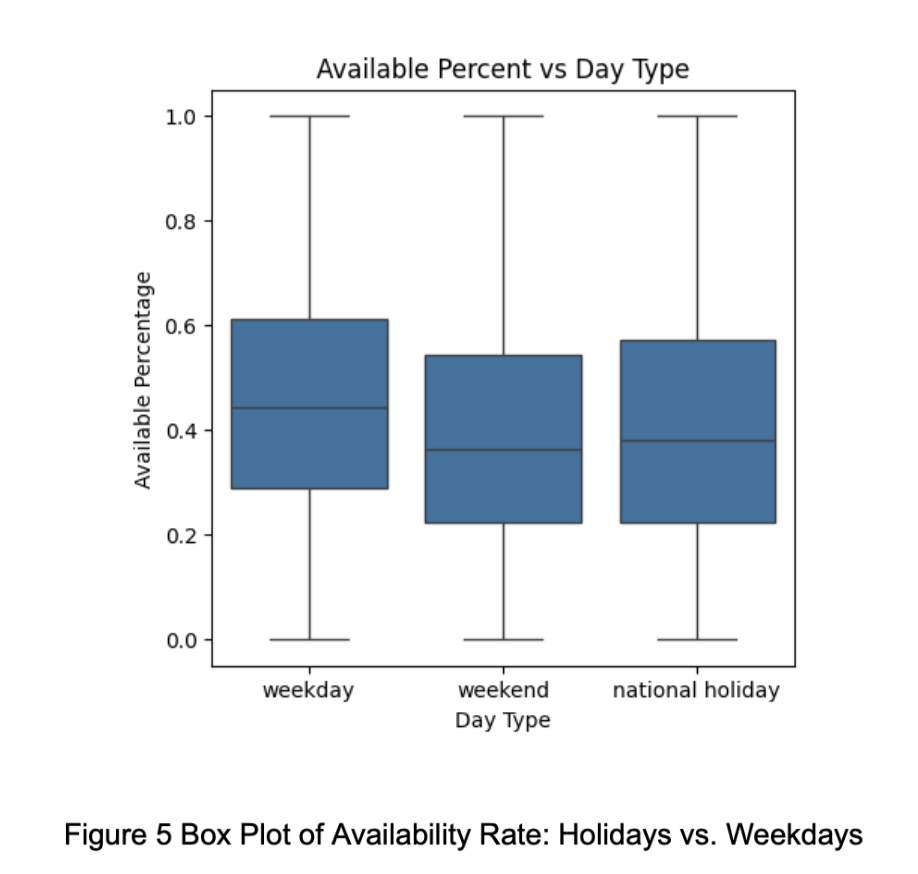
We also found in Figure 5 that national holidays and weekends share similar availability distributions. Therefore, we added a new binary feature day_off to help the model better learn holiday-related patterns.
In addition to time-related features, we noticed that wind direction in the weather forecast data was provided in degrees. To make it more meaningful, we converted the wind direction to radians and further applied sine and cosine transformations to represent directional information in a more interpretable format.
In the feature selection process, we initially experimented with applying one-hot encoding to the ParkingSegmentID. However, the resulting increase in feature dimensionality negatively impacted model performance. Therefore, we decided to exclude ParkingSegmentID from all models to enhance generalization capability.
Next, we applied Elastic Net, which combines both L1 and L2 regularization, to address multicollinearity and perform feature selection. This method helped identify features with non-zero coefficients that are predictive of both the number of available parking spaces and whether the lot is full.
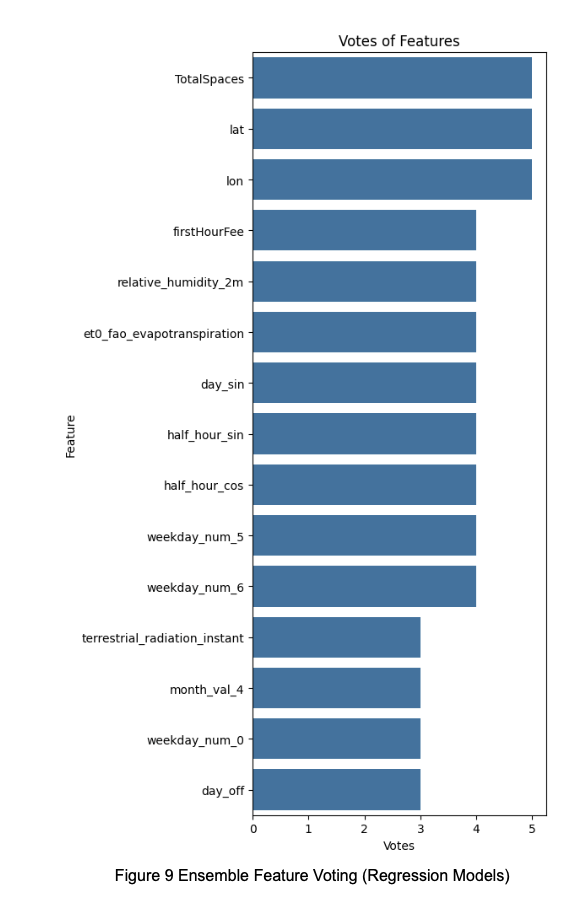
Additionally, we evaluated an ensemble-based feature voting approach across multiple models. Based on this, we selected the top three and top four most frequently chosen features to retrain all models, aiming to further refine performance.
2.1.3 Data Splitting
The collected dataset spans from January 23, 2024 to May 9, 2025, and contains a total of 2,892,661 records after preprocessing. We divided the data into the following subsets:
- Training set: January 23, 2024 to January 22, 2025 (73% of the data)
- Validation set: January 23, 2025 to March 22, 2025 (14% of the data)
- Test set: March 23, 2025 to May 9, 2025 (13% of the data)
Since GNN models require all nodes to have data at every time step in order to function properly, we filtered the test set to include only locations with complete data for all time intervals. After filtering, the test set accounts for approximately 11% of the total data. For models other than GNN, the training and validation sets were kept unfiltered to examine whether the models themselves are suitable for handling this task without strict data constraints.
2.1.4 Imbalanced Data Handling
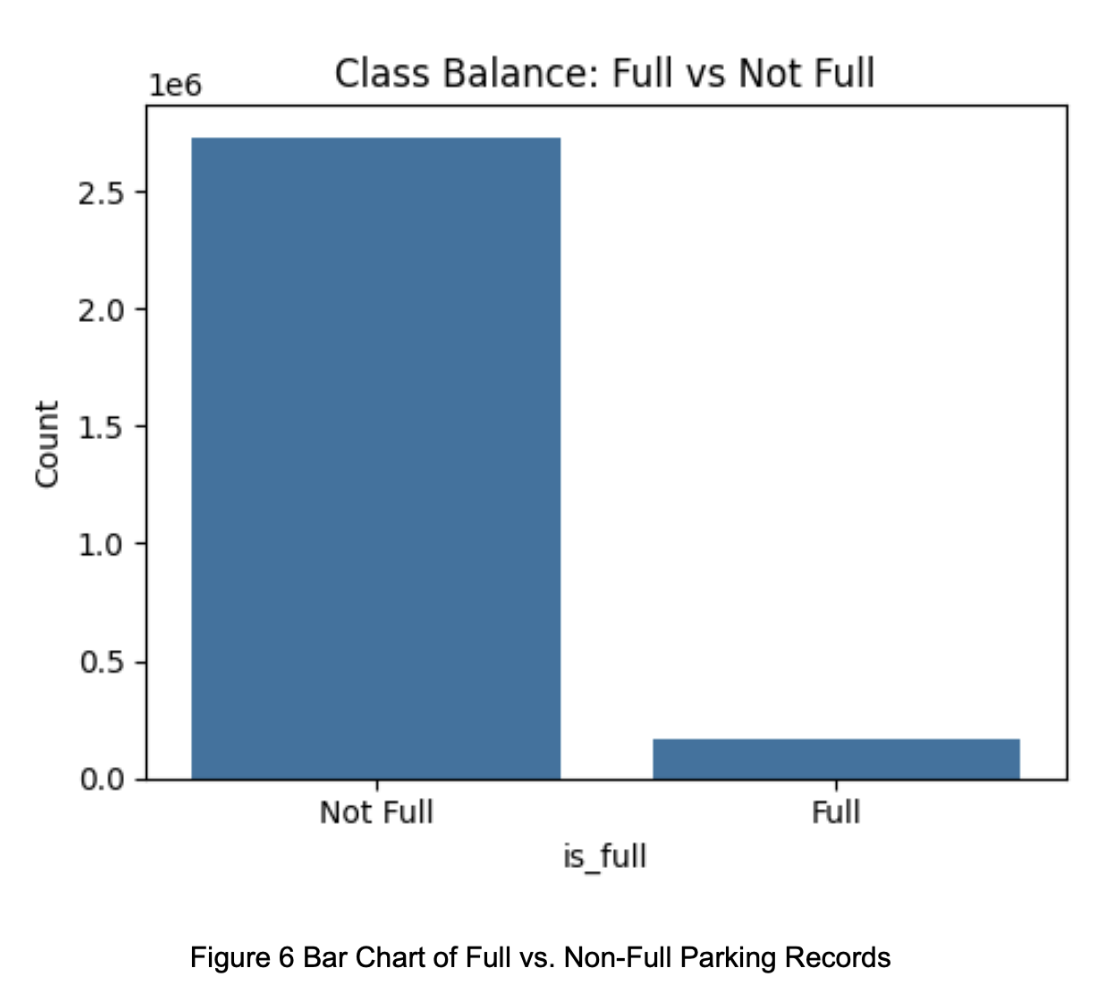
We define a record as “full” if the number of available parking spaces is less than 5% of the total capacity. As shown in Figure 3-9, the dataset is highly imbalanced—only about 6% of the training data represents full status—making it difficult for the model to learn the characteristics of full conditions.
To address this, we applied two strategies for handling class imbalance in the classification models:
- SMOTE (Synthetic Minority Over-sampling Technique)
- Cost-Sensitive Learning
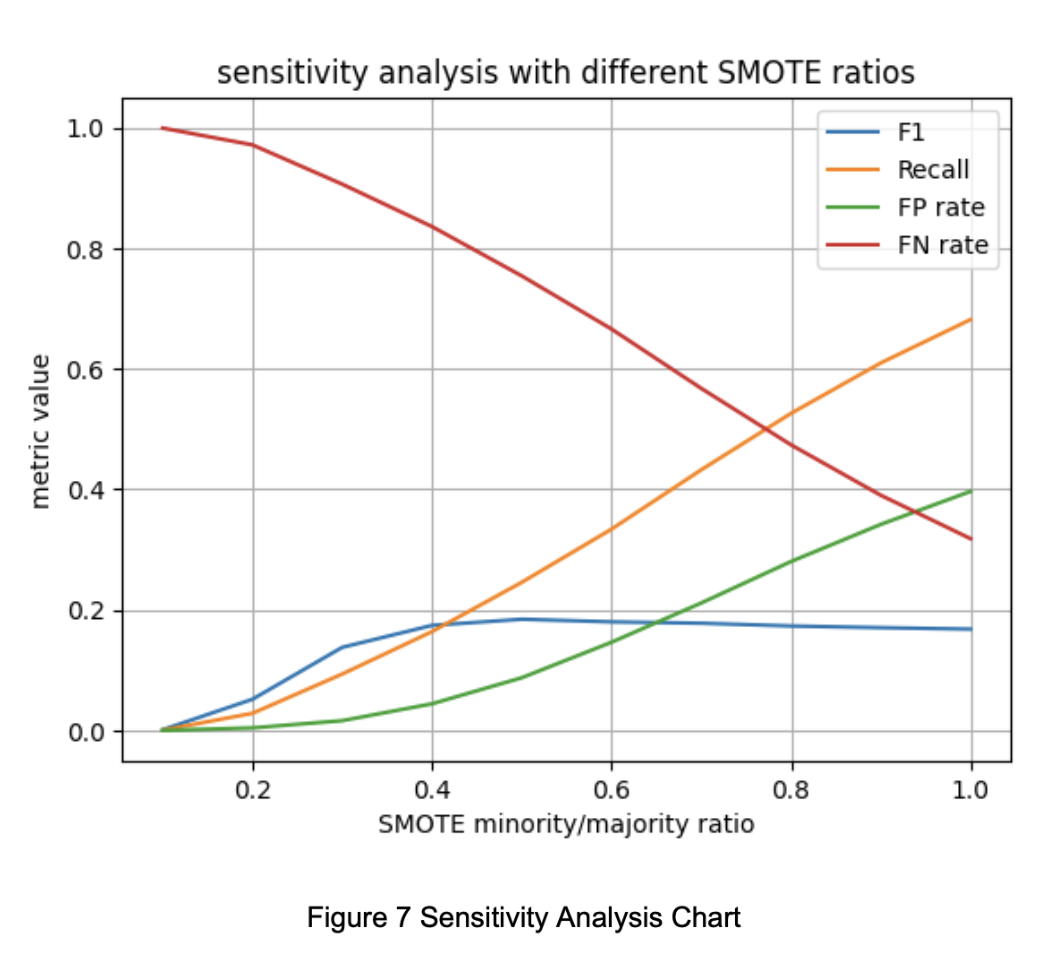
For SMOTE, we first performed a sensitivity analysis using a logistic regression model, varying the oversampling ratio to maximize the F1 score. As shown in Figure 3-10, the best F1 score was achieved when the minority class was oversampled to 50% of the majority class. This ratio was adopted for the final training set.
For cost-sensitive learning, we adjusted the weight of the minority class to be the inverse of the class imbalance ratio, while keeping the majority class weight at 1.0.
Due to GNN’s strict requirement that each time step must have exactly one record per node, SMOTE was not suitable, as it cannot easily generate synthetic data restricted to specific nodes and time points. Therefore, GNN models were only tested with cost-sensitive learning.
2.1.5 Predictive Model Training
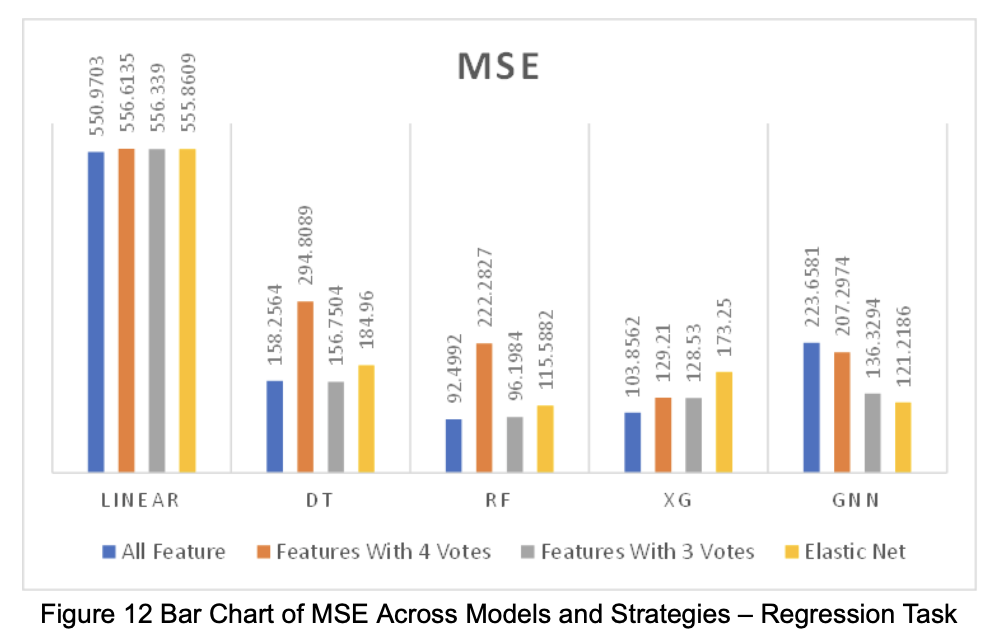
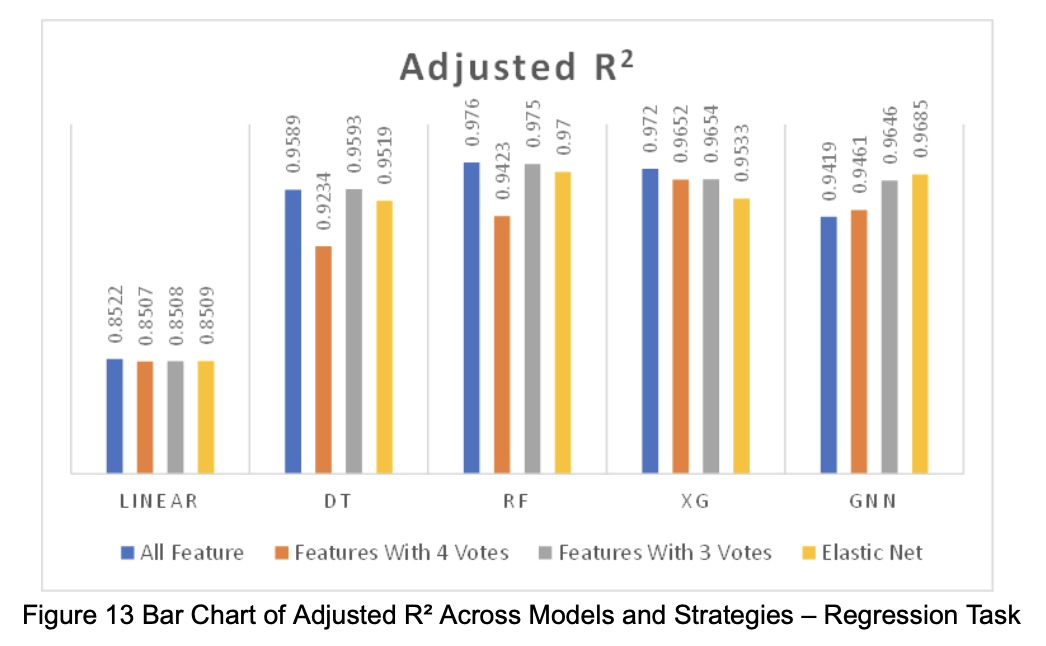
For the regression task, we trained and evaluated the following models: Linear Regression, Decision Tree, Random Forest, XGBoost, and Graph Neural Network (GNN). To assess model performance, we used Mean Squared Error (MSE) to reflect the model’s ability to predict extreme values. In addition, to evaluate how models perform under different feature set sizes, we also adopted Adjusted R² as a metric.
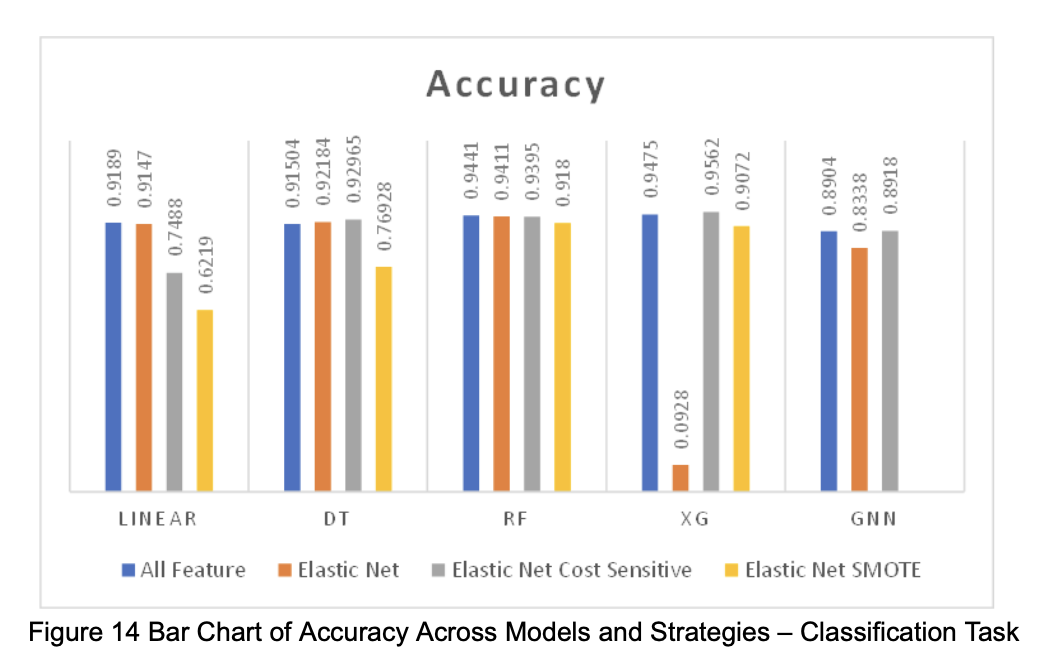
For the classification task, we trained and evaluated Logistic Regression, Decision Tree, Random Forest, XGBoost, and GNN. Due to the extreme class imbalance in the data, using a fixed probability threshold of 0.5 would result in a large number of false negatives (FN). Therefore, during validation, we selected the threshold that achieved the highest F1 score, and used that threshold for the test set.
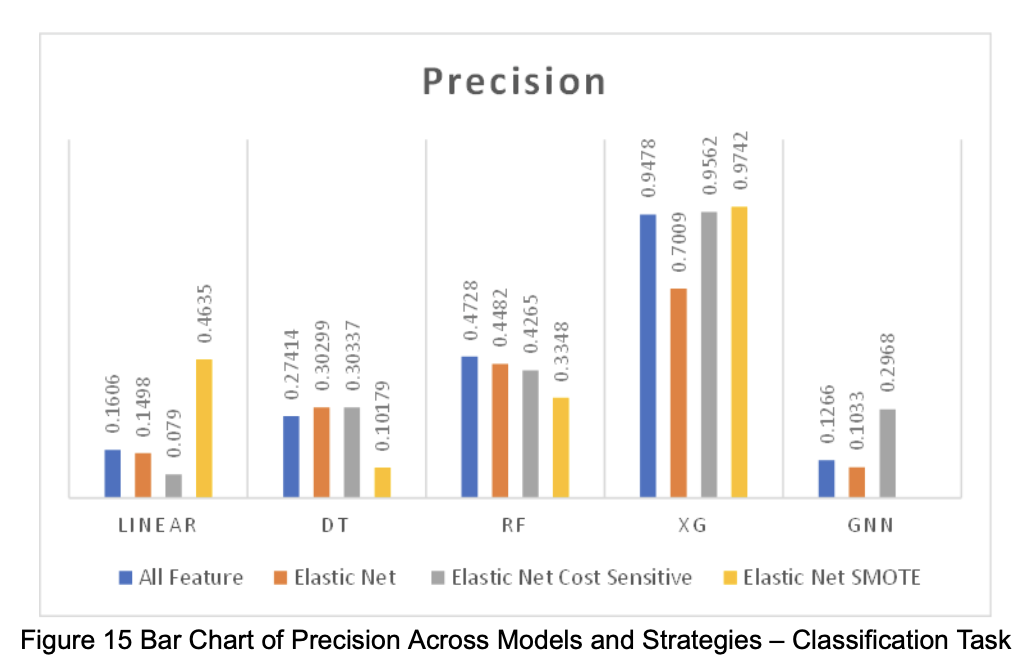
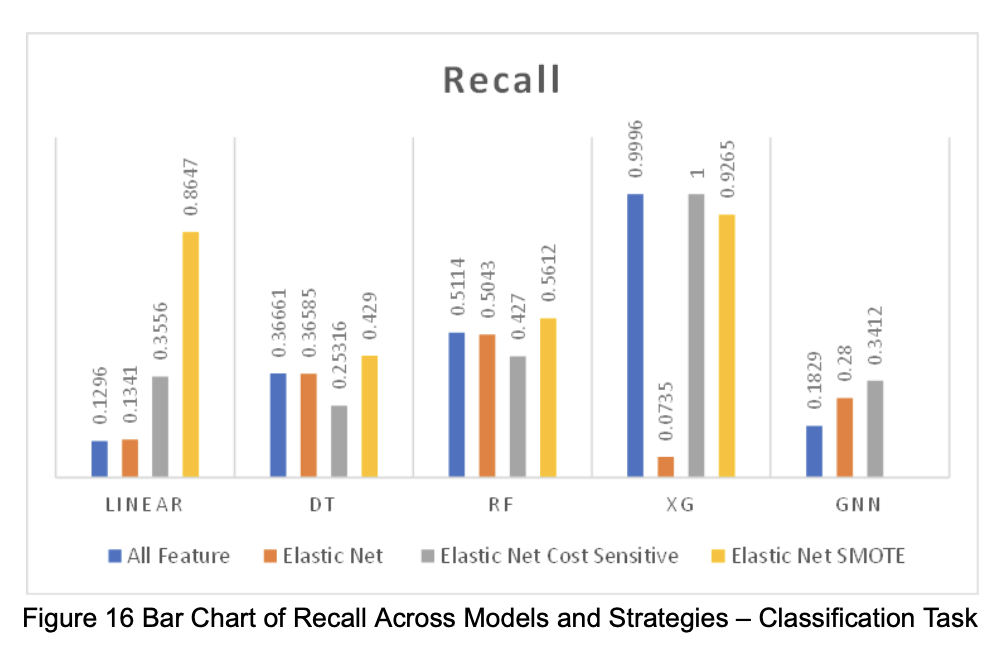
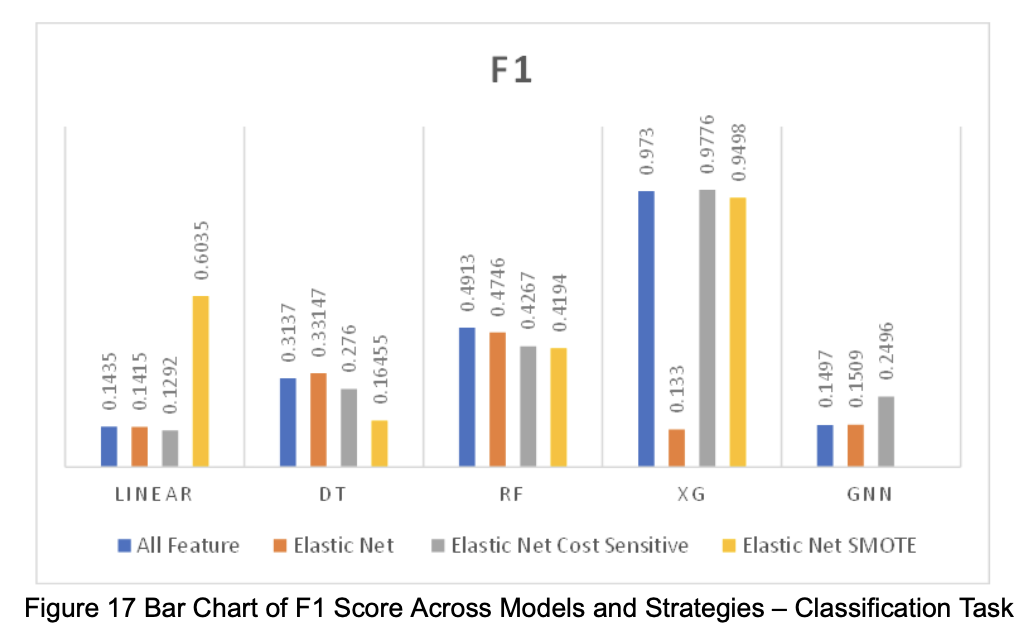
In terms of evaluation metrics, we reported Accuracy for its intuitive interpretation. However, since the primary goal is to inform users about potential full-capacity situations, we placed greater emphasis on the F1 score, which balances recall and precision, avoiding misleadingly high accuracy caused by the dominance of non-full data points.
Furthermore, due to the highly imbalanced nature of the dataset, using only ROC-AUC could result in an overly optimistic view of model performance while failing to detect full parking conditions accurately. Thus, we also adopted PRC-AUC (Precision-Recall Curve AUC) to evaluate the model’s ability to identify minority-class full-capacity cases more effectively.
2.2 Method Selection and Justification
2.2.1 Feature Selection Approach
Since the initial dataset contained 60 features, it was difficult for models to effectively identify meaningful patterns. To address this, we adopted Elastic Net and an ensemble-based feature voting approach to assist in feature selection.
We chose Elastic Net because it combines both L1 and L2 regularization, allowing it to effectively manage multicollinearity and improve model stability. However, since Elastic Net tends to retain features that are linearly related to the target variable, we also wanted to capture features with potential nonlinear relationships.
To achieve this, we further applied an ensemble feature voting strategy across multiple models, selecting features that were consistently identified as important to ensure broader representativeness in the final feature set.
2.2.2 Handling Data Imbalance
As shown in Figure 6, the training dataset is highly imbalanced, making it likely that the model would tend to predict the majority class (non-full status). To mitigate this, we employed SMOTE (Synthetic Minority Over-sampling Technique), which generates new synthetic minority samples through interpolation. This helps balance the dataset without simply duplicating existing samples.
However, due to the constraints of GNN models, we also explored cost-sensitive learning, which is compatible with GNN. By adjusting sample weights, the model applies greater updates to the loss associated with minority-class examples. This compensates for the discrepancy in update frequency between the majority and minority classes. This method enhances the model’s ability to recognize full-capacity situations without altering the original data distribution, making it more robust for real-world application.
2.2.3 Predictive Model Selection
For model selection, we began by using basic linear models (Linear/Logistic Regression) as baselines to assess whether there is a linear relationship between features and the target variable. Since purely linear models are limited in capturing complex patterns, we next tested Decision Trees, which can model non-linear relationships.
To further reduce learning errors from non-linear models, we evaluated two ensemble techniques:
- Random Forest, a bagging model that reduces variance
- XGBoost, a boosting model that reduces bias
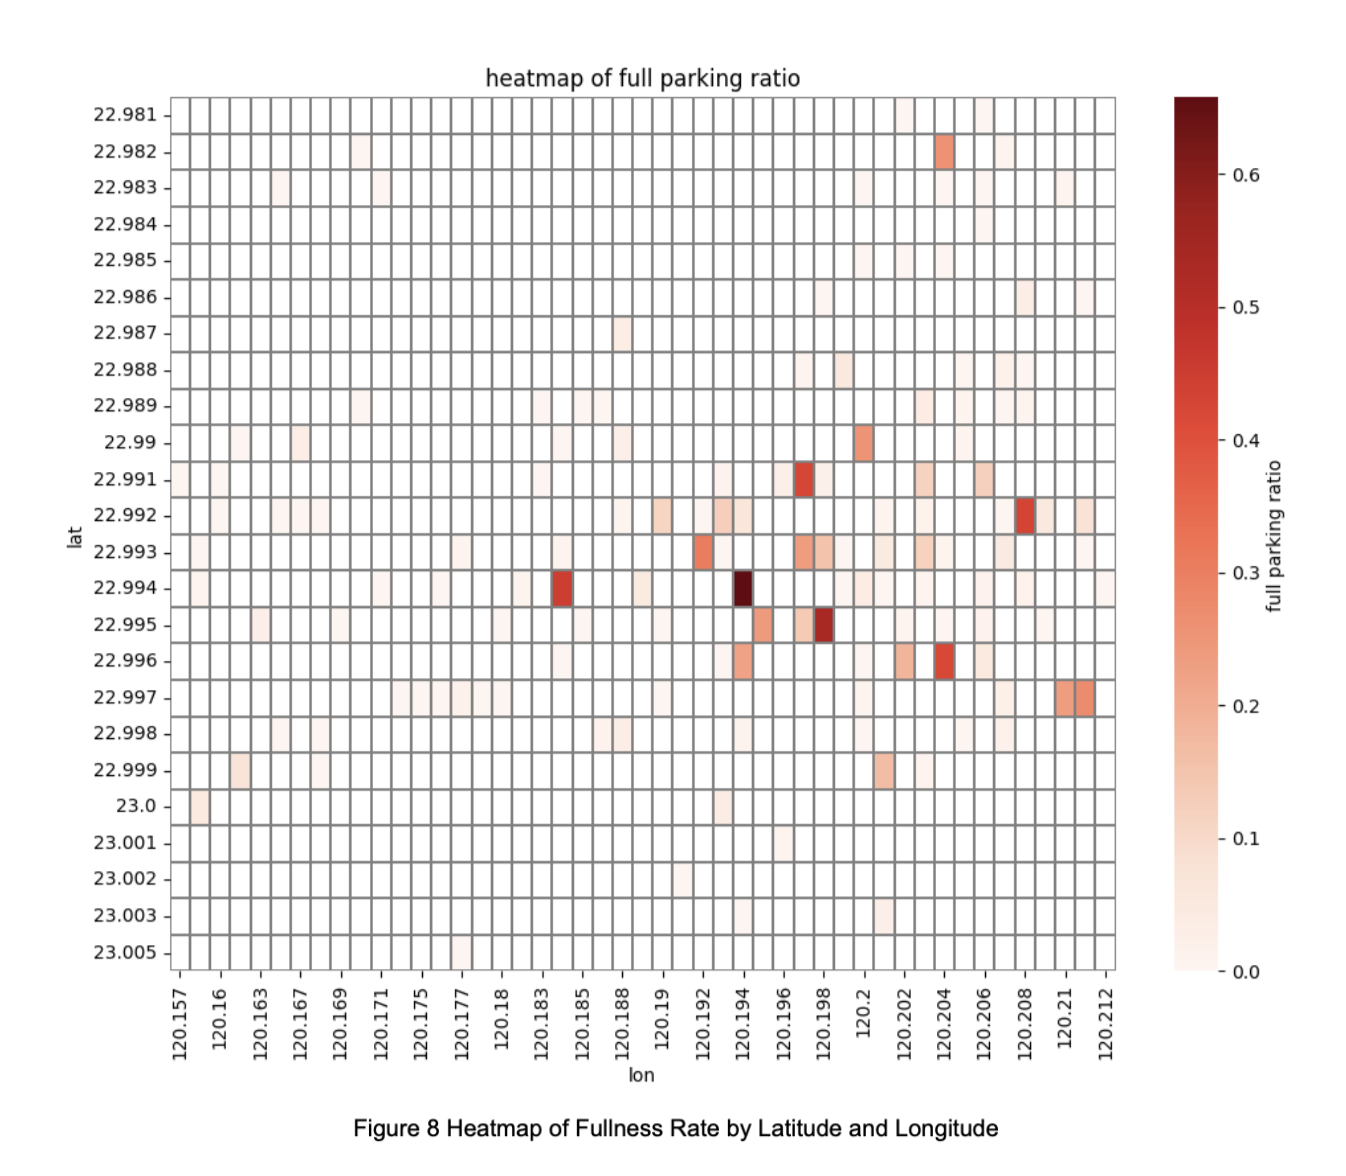
During the EDA process, we also constructed a heatmap (Figure 8), which revealed localized clustering in the full-capacity distribution. Based on this spatial relationship, we additionally selected the Graph Neural Network (GNN), which is designed to model interactions between nodes (parking segments) and capture spatial dependencies. This makes GNN particularly suitable for this task alongside traditional machine learning models.
3. Data Collection and Analysis Results**
3.1 Data Collection
We collected three types of data:
- Parking availability records
- Historical weather forecasts
- National holiday data
The data sources include TDX (Transport Data eXchange), the Open-Meteo historical forecast API, and TaiwanCalendar along with Google Calendar. All data were acquired through the respective APIs provided by these services.
These three data sources were merged using 30-minute intervals and geographic coordinates (latitude and longitude). After merging, we corrected invalid values and standardized categorical features. Specifically:
- Cyclical variables with many categories (e.g., day count, half-hour intervals, wind direction) were transformed using sine and cosine encoding.
- Cyclical variables with fewer categories (e.g., day of the week, month) were encoded using one-hot vectors.
The final merged dataset spans from January 23, 2024 to May 9, 2025, resulting in a total of 2,892,758 records and 61 features.
3.2 Analysis
3.2.1 Overview of Analytical Design
We designed and evaluated eight predictive strategies:
- Use all features to predict the average number of available parking spaces in each time interval.
- Use all features to predict whether parking spaces are available in each time interval (binary classification).
- Use the top 20 features from each model, select those chosen by at least 4 models, and predict the average number of available parking spaces.
- Use the top 20 features from each model, select those chosen by at least 3 models, and predict the average number of available parking spaces.
- Use features selected by Elastic Net from the binary classification task (availability or not), and predict the average number of available parking spaces.
- Use features selected by Elastic Net from the regression task (average available spaces), and predict whether parking spaces are available.
- Use features from Elastic Net (regression task) and apply cost-sensitive learning to predict whether parking spaces are available.
- Use features from Elastic Net (regression task), apply SMOTE to rebalance the data, and predict whether parking spaces are available.
For each strategy, we applied five different models:
- Linear/Logistic Regression
- Decision Tree
- Random Forest
- XGBoost
- Graph Neural Network (GNN)
The main libraries and tools Used:
- Linear/Logistic Regression:
LinearRegression,LogisticRegression - Decision Tree:
DecisionTreeRegressor,DecisionTreeClassifier - Random Forest:
RandomForestRegressor,RandomForestClassifier - XGBoost:
XGBRegressor,XGBClassifier - Graph Neural Network:
torch_geometric - Data Preprocessing:
pandas
3.2.2 Feature Selection Methods and Results for Each Model
After performing feature selection for each model, we obtained the top 20 features identified by each algorithm. Based on the aggregated vote counts (as shown in Figure 9), we used the most frequently selected features as the basis for Strategy 3 and Strategy 4.
The detailed voting results are presented in Table 2.
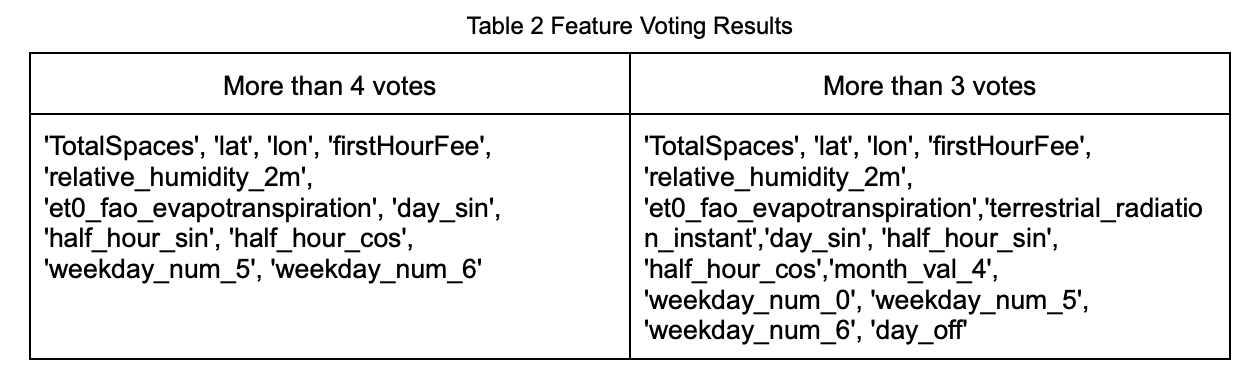
In Strategies 5 through 8, we used the features selected by Elastic Net as the basis for modeling. The selection results were categorized into two groups: one based on regression models and the other based on classification models. The feature weights are shown in Figures 10 and 11, and the detailed voting results are summarized in Table 3.
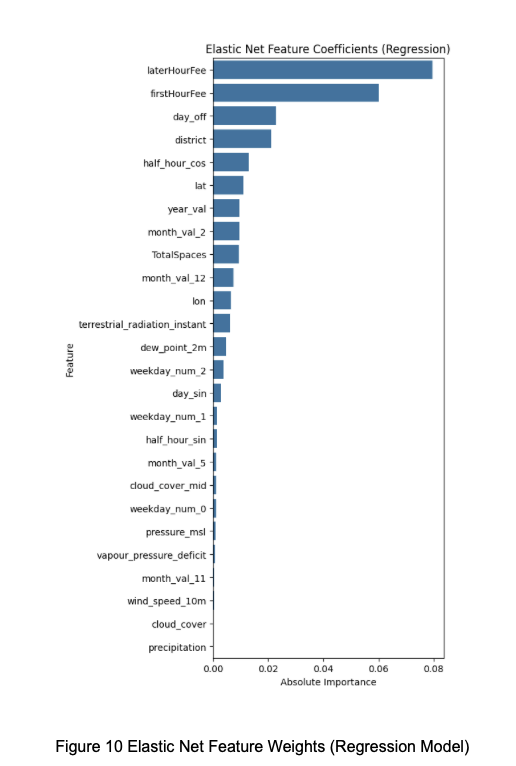
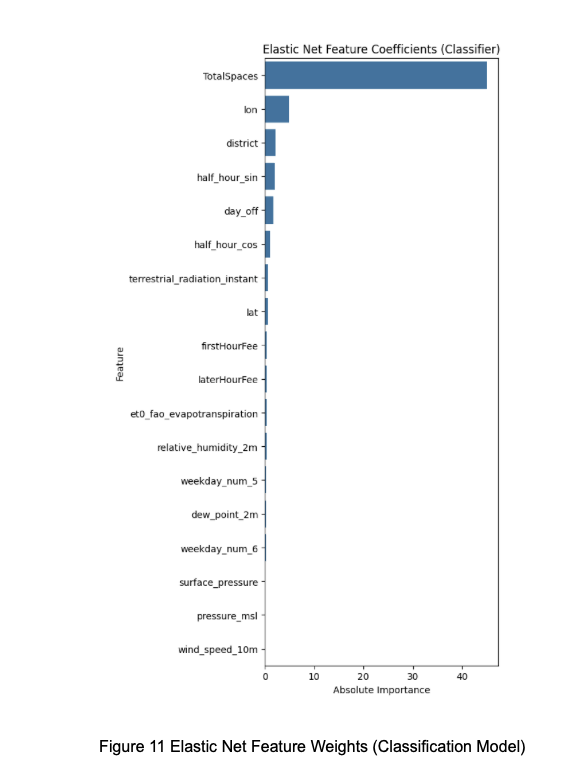
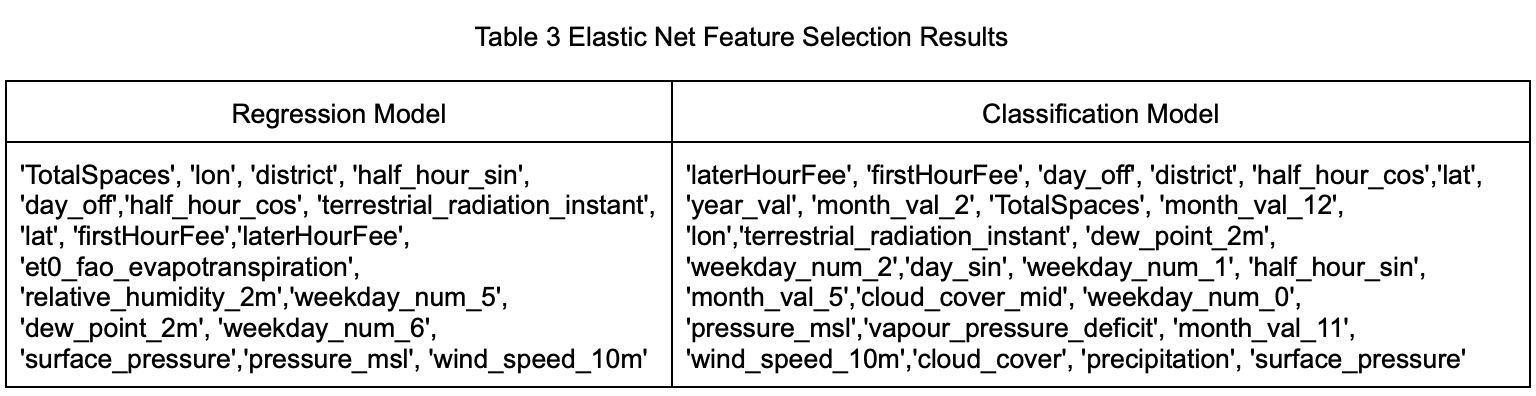
The Elastic Net feature selection was primarily implemented using ElasticNetCV from the sklearn.linear_model module.
3.2.3 Data Imbalance Handling and Model Hyperparameter Tuning
For the classification task, we applied two methods to address data imbalance: SMOTE (Synthetic Minority Over-sampling Technique) and Cost-Sensitive Learning.
We used features selected via Elastic Net, and applied SMOTE using the imblearn.over_sampling package to generate a balanced dataset. This oversampled dataset was used to train four models: Logistic Regression, Decision Tree, Random Forest, and XGBoost. Due to model constraints, GNN cannot directly apply SMOTE for data balancing. Therefore, we adopted a Cost-Sensitive Learning approach for GNN.
The specific implementation of cost-sensitive weights in Python is as follows:
N_neg = len(df_train_scaled.loc[df_train_scaled['is_full'] == False])
N_pos = len(df_train_scaled.loc[df_train_scaled['is_full'] == True])
pos_weight = N_neg / (N_pos + 1e-8)
neg_weight = 1
This approach assigns a higher penalty to errors made on the minority class (i.e., misclassifying full parking records as not full), helping the model better learn to detect full-capacity cases despite their scarcity in the data.
To improve prediction performance and prevent overfitting, hyperparameter tuning was performed for all models:
- For Linear Regression, Decision Tree, Random Forest, and XGBoost, we used GridSearch to explore parameter combinations.
- For the Graph Neural Network (GNN) model, we used the Optuna framework to optimize hyperparameters.
These tuning strategies ensured that each model achieved optimal performance on the same dataset, providing a stable and reliable foundation for subsequent analysis.
3.2.4 Detailed Comparison of Each Strategy
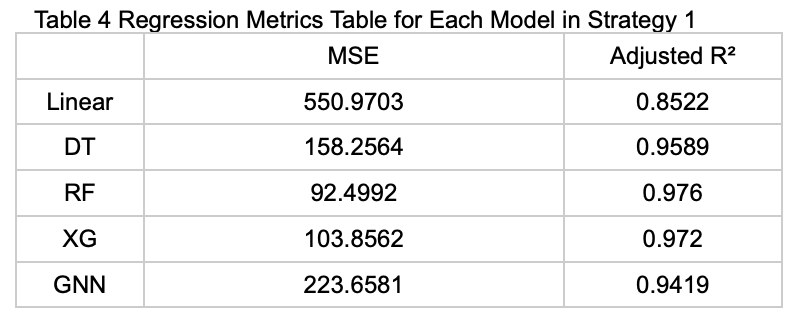
Strategy 1: Using All Features to Predict the Average Number of Available Parking Spaces for Each Time Interval
The table below (Table 4) presents the performance metrics of each model on the test set under this prediction strategy.
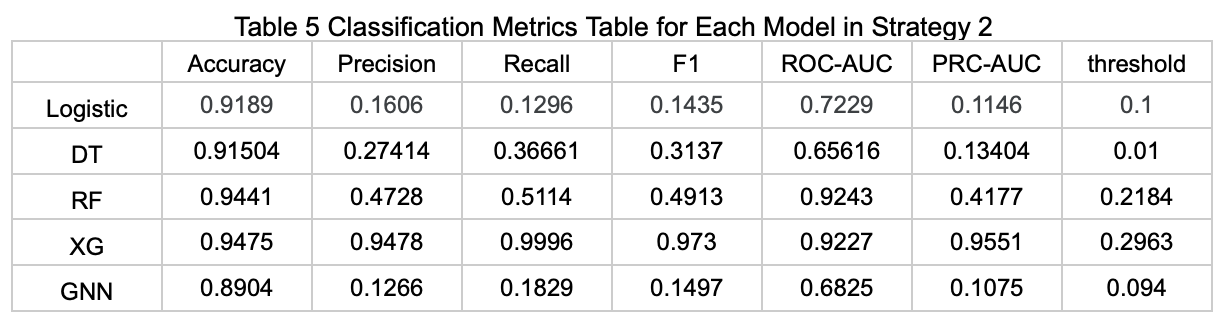
Strategy 2: Using All Features to Predict Whether Parking Spaces Are Available in Each Time Interval
The table below (Table 5) presents the performance metrics of each model on the test set under this prediction strategy.
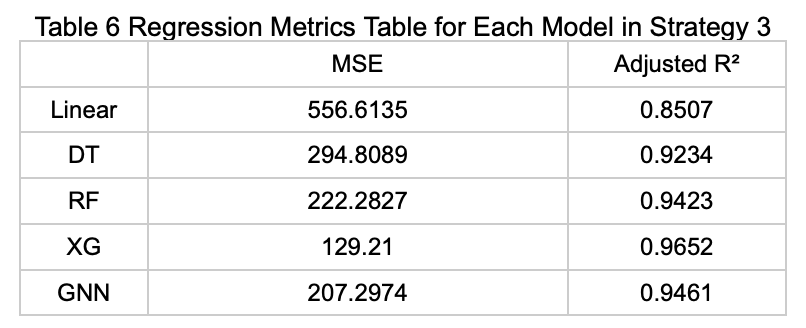
Strategy 3: Using Features Selected by at Least 4 Models Among the Top 20 to Predict the Average Number of Available Parking Spaces
The table below (Table 6) presents the performance metrics of each model on the test set under this prediction strategy.
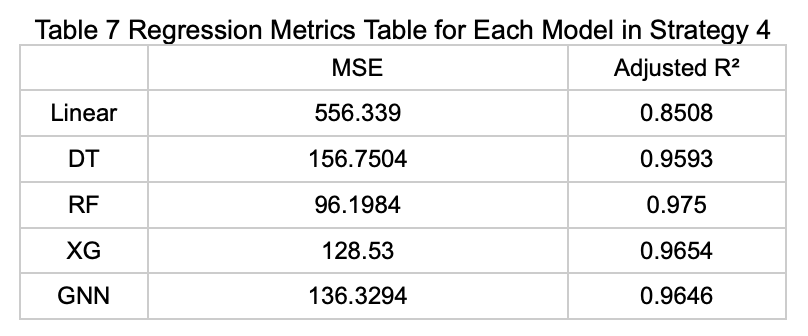
Strategy 4: Using Features Selected by at Least 3 Models Among the Top 20 to Predict the Average Number of Available Parking Spaces
The table below (Table 7) presents the performance metrics of each model on the test set under this prediction strategy.
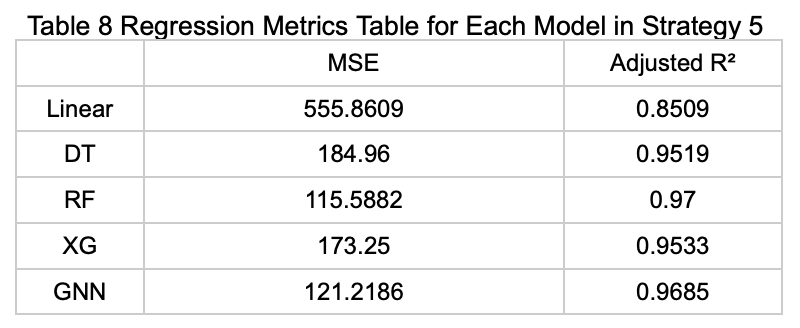
Strategy 5: Using Features Selected by Elastic Net Based on the Classification Task (Parking Availability) to Predict the Average Number of Available Parking Spaces
The table below (Table 8) presents the performance metrics of each model on the test set under this prediction strategy.
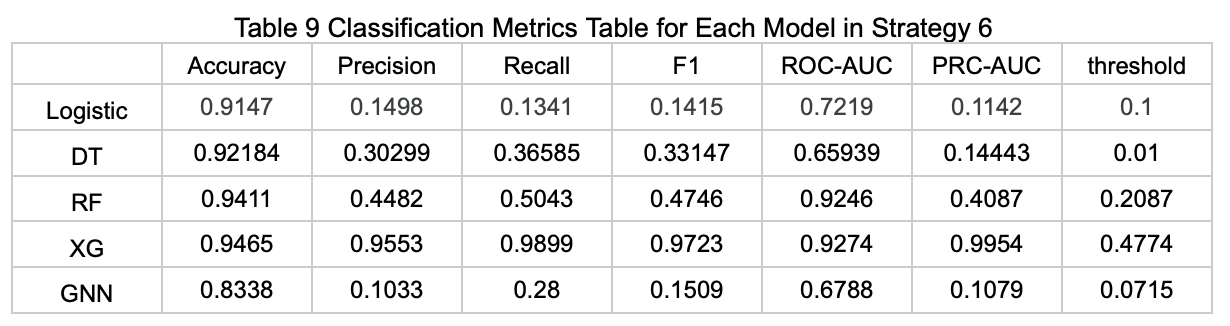
Strategy 6: Using Features Selected by Elastic Net Based on the Regression Task (Average Available Parking Spaces) to Predict Whether Parking Spaces Are Available
The table below (Table 9) presents the performance metrics of each model on the test set under this prediction strategy.
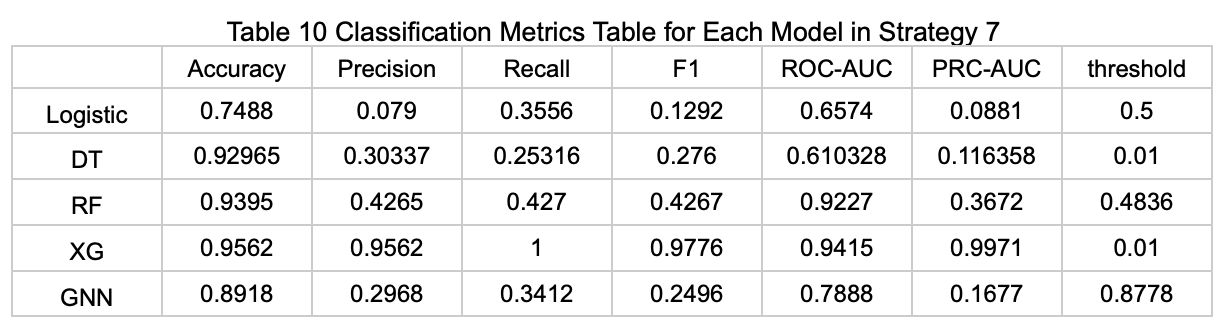
Strategy 7: Using Features Selected by Elastic Net Based on the Regression Task (Average Available Parking Spaces), Combined with Cost-Sensitive Learning to Predict Whether Parking Spaces Are Available
The table below (Table 10) presents the performance metrics of each model on the test set under this prediction strategy.
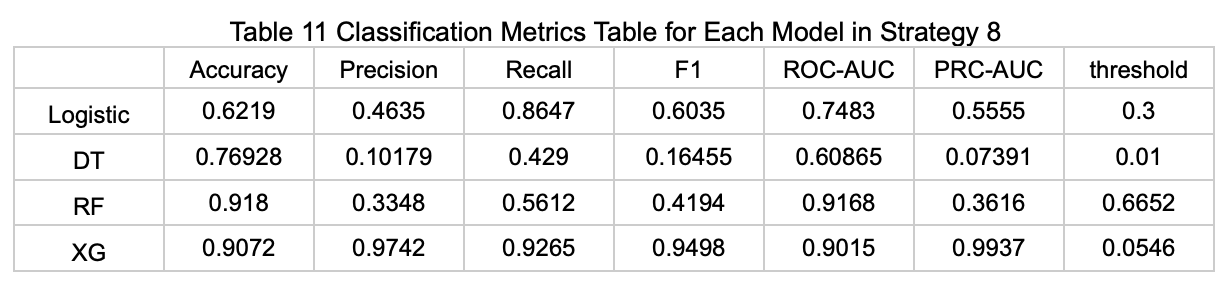
Strategy 8: Using Features Selected by Elastic Net Based on the Regression Task (Average Available Parking Spaces), Applying SMOTE to Balance the Data, and Then Predicting Whether Parking Spaces Are Available
The table below (Table 11) presents the performance metrics of each model on the test set under this prediction strategy. Note: Due to model constraints, the GNN model could not be applied under this strategy.
Based on the performance of each model in the two tasks (regression and classification), we visualized the numerical results as shown in the figures below (Figures 12–17).
3.3 Interpretation of Results
Based on model training results and feature importance rankings, we categorized the variables with significant influence on predicting parking space availability into three major groups: weather-related, time-related, and parking space-related features. These variables not only show strong explanatory power within the data but also align with real-world traffic and user behavior patterns.
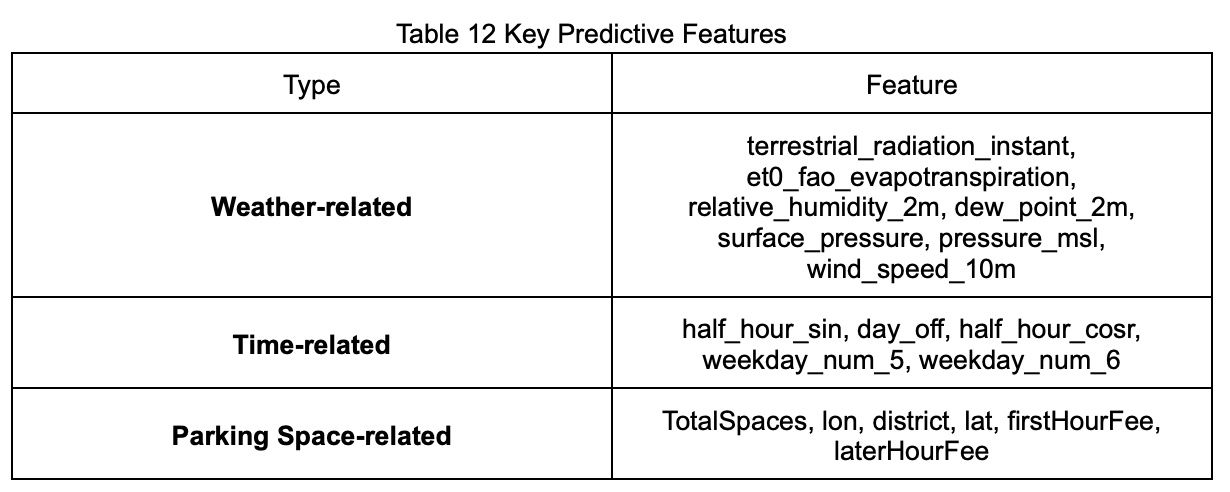
3.3.1 Weather-Related Information
Weather changes directly affect people’s choice of transportation. On rainy days or under conditions of low pressure and high humidity—often associated with discomfort and transportation inconvenience—people tend to drive to avoid exposure to wind, sun, or rain, which increases parking demand. For instance, high humidity and low atmospheric pressure often signal upcoming rain or unstable weather. These weather-related features ranked among the top in model importance, reflecting their influence on parking demand.
3.3.2 Time-Related Information
Time is a crucial factor in daily traffic and parking demand. During weekday rush hours or holidays, demand for parking often spikes, leading to reduced availability. In contrast, during off-peak periods such as midnight or midday on weekdays, more parking spaces are typically available. We used half_hour_sin and half_hour_cos to encode time as cyclical features, enabling the model to capture intra-day behavioral patterns. Additionally, the day_off feature helps the model identify holidays and special dates, further improving prediction accuracy.
3.3.3 Parking Space-Related Information
The characteristics of the parking facility itself have a direct impact on availability. Parking lots with fewer total spaces are more likely to become full during high-demand periods. Geographic information, such as latitude, longitude, and district, helps the model capture whether a location is in a busy area. Moreover, the charging policy may affect user preferences—lots with lower fees are more likely to be filled during peak hours. These features help the model understand usage patterns under different conditions.
3.4 Practical Value of the Model
The proposed model has strong potential for real-world applications, offering value to both individual users and parking lot operators by supporting planning, decision-making, and operational optimization.
3.4.1. For General Users: Improved Planning Efficiency Through Real-Time Parking Insights
While common knowledge may suggest that “parking demand increases on rainy days,” or that “downtown areas are likely full on weekends or at night,” such assumptions are often vague and insufficient for precise planning. Our model combines weather, time, and location-specific features to provide real-time predictions of available parking spaces at specific time intervals.
With this information, users can access concrete, location-specific insights during trip planning, reducing uncertainty when searching for parking. When the model predicts that a lot is likely to be full, it can also recommend nearby alternatives (e.g., “Lot 1 may be full, consider Lot 2” or “Lot 3 still has approximately 5 available spaces”), saving users time, cost, and stress caused by circling around.
This improves information transparency and gives users more proactive control, ultimately enhancing the overall travel experience.
3.4.2 For Parking Operators: Optimizing Capacity Allocation and Strategy
Beyond providing real-time parking information, the model also serves as a strategic tool for long-term planning and management. By analyzing historical and real-time trends, operators can identify areas frequently at or near capacity—such as around shopping districts, metro stations, or event venues. These insights help justify decisions to expand existing facilities or build new parking structures, thereby increasing service capacity and customer satisfaction.
In addition, the model can support dynamic pricing and discount strategies. For example, operators may raise rates during predicted high-demand periods to manage congestion, or offer time-limited discounts during low-demand hours to boost usage.
Ultimately, this approach facilitates optimal resource allocation and enhances the operational efficiency of parking facilities.
4. Conclusion and Future Work
This study centers on the problem of predicting parking space availability, addressing a concrete and common issue in society: the supply and demand of parking. We successfully developed a preliminary predictive model that integrates weather forecasts and historical parking usage data to estimate parking availability for specific locations and time periods.
By aggregating weather information, holiday data, and parking history, we reformulated the problem into both a regression and classification task. Applying the knowledge gained from the course—including data preprocessing, feature engineering, model training, and evaluation—we systematically assessed the performance of different models on this task.
We employed Elastic Net regularization and ensemble feature voting to perform feature selection, effectively reducing the negative impact of high-dimensional features on model stability and performance. For the highly imbalanced classification task, we used SMOTE for oversampling the minority class and cost-sensitive learning to improve the model’s sensitivity to full-capacity cases, thereby enhancing both its practicality and interpretability.
Furthermore, our data splitting approach simulated realistic prediction scenarios by using time-based partitioning. For the GNN model, we also tailored the dataset to meet its structural requirements, ensuring fair comparisons across all models. Ultimately, we evaluated a variety of models and handling strategies, using multiple metrics—including MSE, Adjusted R², F1 Score, ROC-AUC, and PRC-AUC—to thoroughly compare performance and ensure objectivity and practical value.
The experimental results of this study demonstrate clear potential for practical application in helping users plan parking in advance. In future work, we aim to further improve prediction accuracy, expand coverage to multiple cities and parking types, and integrate real-time data and pricing information to develop an interactive parking recommendation system.
In the long term, our goal is to integrate this system with smart traffic management platforms to improve urban traffic flow and parking efficiency, contributing to the broader vision of smart cities.